Engineering View Plans
REAP Engineering View
THIS PAGE IS UNDER CONSTRUCTION
Summary
The REAP Engineering View facilitates scientists with the design and operation of real-time sensor networks. It provides:
- Specification - The layout of a site is described in the Kepler GUI showing hardware components and how they are connected. Metadata for each component can be specified including location (lat/lon/alt), sampling rates, etc.
- Monitoring - Overall "health" of a site is displayed along with plots of recent sensor data.
- Analysis & Simulation - User-defined workflows can be designed and executed that analyze either real or simulated sensor data.
- Control - Authorized users can configure sensors, e.g., turn on/off or change sampling rates.
Specification
Use Cases
- Describe the hardware at a sensor network site along with how they are connected.
- Facilitate future design changes.
- Enables other use case scenarios.
The Engineering View provides a graphical interface to describe a sensor site using the Kepler GUI. Hardware components such as sensors, data loggers, antennas, etc., can be dragged-and-dropped onto the canvas and connected to one another. The following figure shows an example:
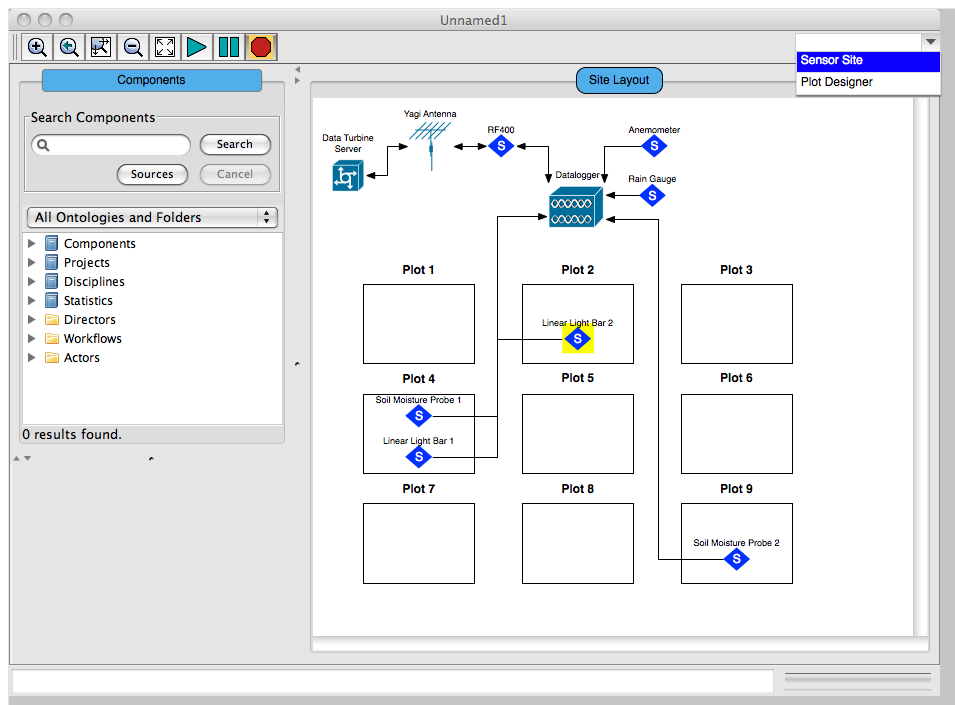
Figure 1
The site described in Figure 1 is divided into nine plots and shows where each sensor is located. All sensors are connected to the data logger, which communicates with a Data Turbine server. (Data Turbine is shown in this example, but other types of streaming data middleware may be used).
Each component at a site may further be annotated with, e.g., latitude/longitude/height, firmware/software version, power requirements, etc. Users can modify these properties by double-clicking on the component:
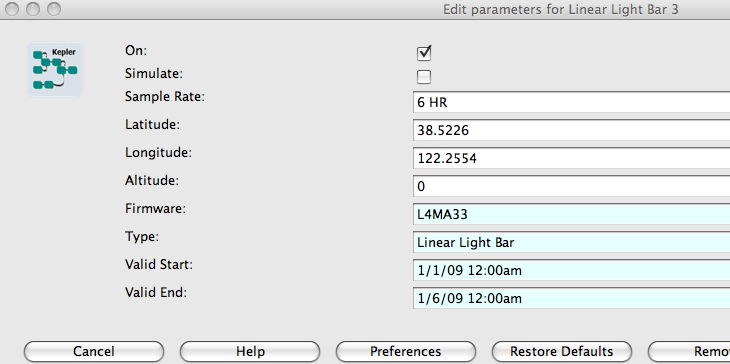
Figure 2
Optionally, the low-level wiring details for the site can be specified in a spreadsheet interface as shown in Figure 3. Each row in the table documents the wiring for a component; each cell represents the wire between that component and the data logger. The cell color matches the actual wire color.
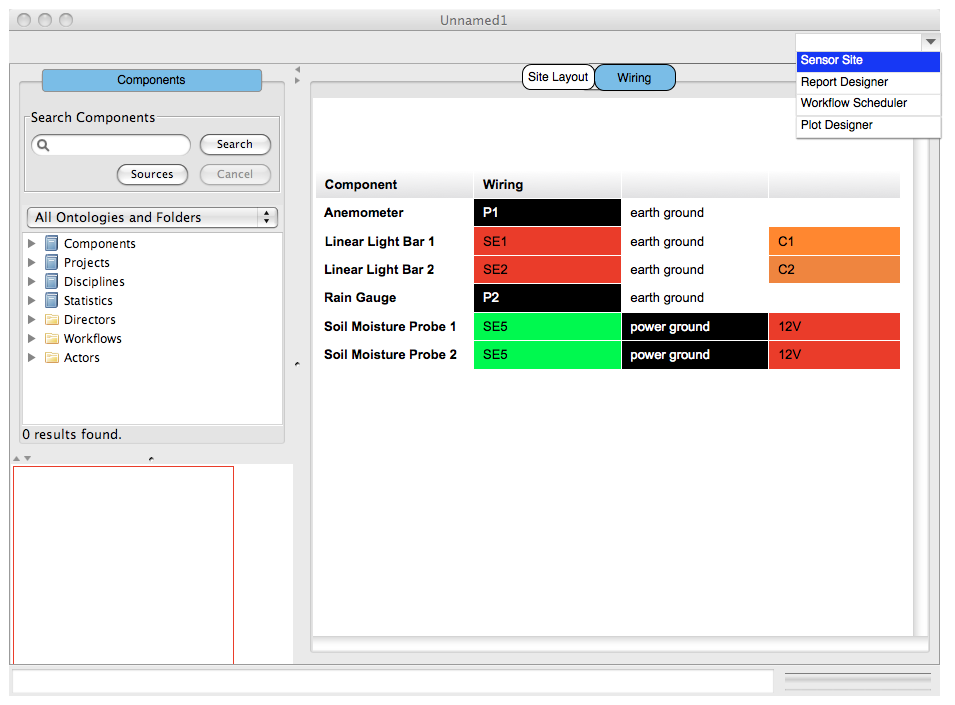
Figure 3
Initially, the scientist or engineer will create the site layout and set the component properties using the Kepler GUI, but we plan to investigate techniques for automatically building the site specification. For example, when a new data logger component is created, the user configures it to point at a Data Turbine channel that represents the site, the sensor components could then be automatically generated on the canvas, one for each child channel that represents a sensor. The sensor components may then be configured in detail by the user. We might push these configurations into a metadata channel associated with each component, so that another user would get them when they auto-generate a workflow for this site.
The site layouts can also be exported to or imported from SensorML, an OGC standard for describing sensors and measurement processes.
The Engineering View can generate a printable report containing detailed information about a site, including hardware component names, types, locations, wiring, etc.
Additionally, the site can be viewed as an overlay in Google Earth once geographic coordinates are specified for the hardware components. Google Earth may be embedded in the Kepler GUI, or a KML file containing the overlay may be exported.
Monitoring
Use Cases
- Determine if all sensors at a site are operating and sending data.
- Show the recent data from a group of sensors at a site.
- Send email when a sensor transmits bad data.
When the user hits the run button in the Engineering View, the components' icons change color to denote their "health", e.g., green for OK, or red for error. An example is shown in the following figure:
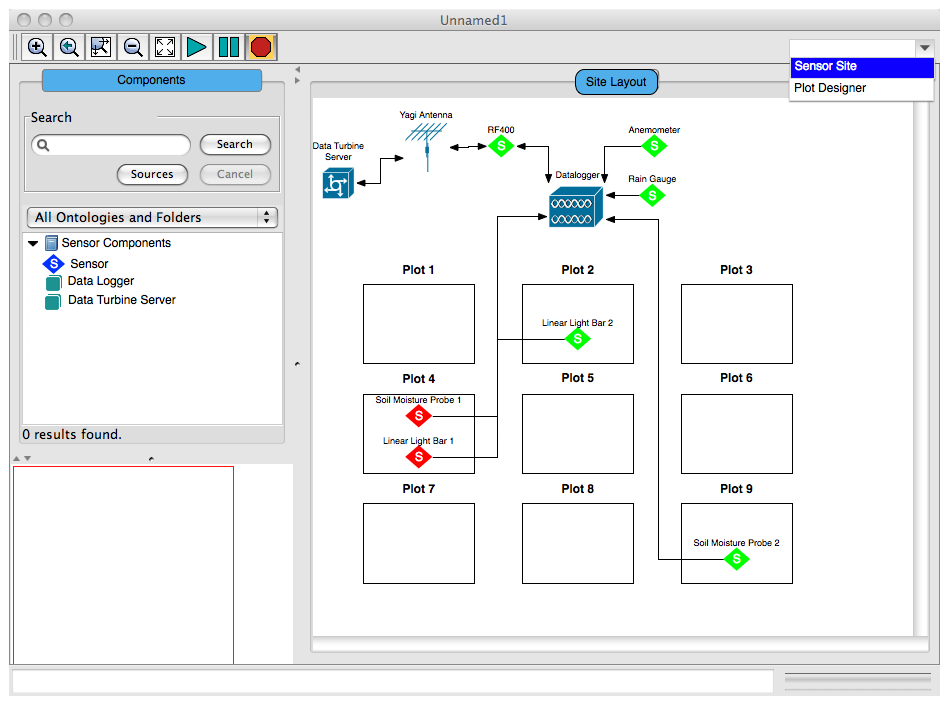
Figure 4
Further, a different view will plot the most recent values of sensor data. This view could present data from individual sensors, or group the data based on sensor type as shown below:
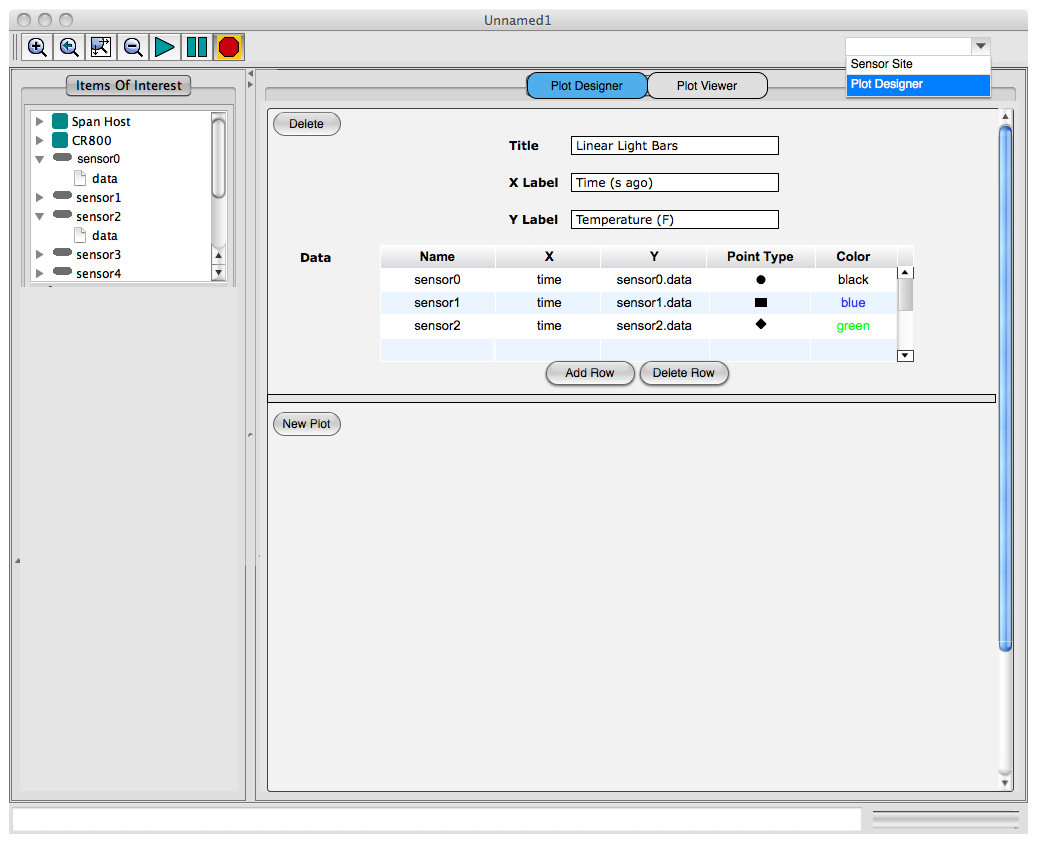
Figure 5a
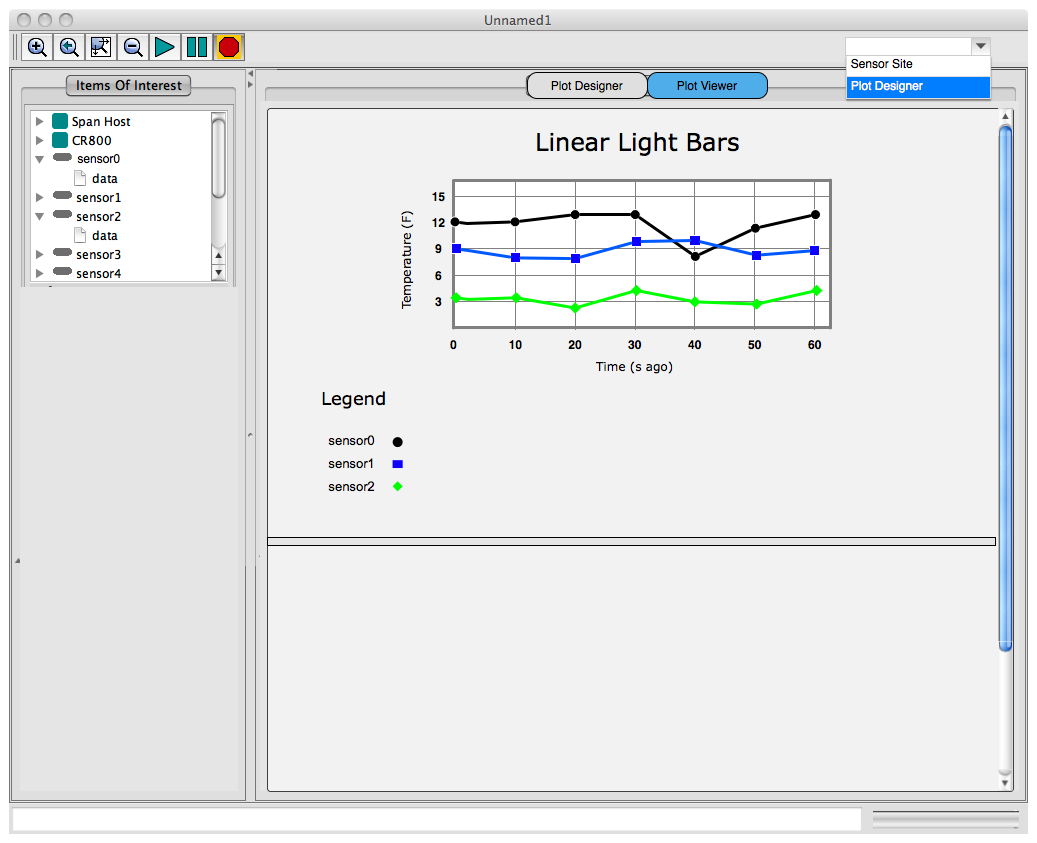
Figure 5b
Figures 4 and 5 display simple data monitoring within the Kepler GUI running on a user's laptop or desktop computer.
Additional types of sensor monitoring may involve complex analyses that examine all data such as QA/QC. A scientist can build workflows and report designs using the existing Reporting suite GUIs (Fig 6) to perform these tasks. The user may upload a workflow with report design, and then use the Scheduler (Fig 7) to schedule the running of this workflow. The scheduler will run this workflow at the designated times, and place the generated results (run-kars) on the same server. Generated report instances (in the run-kars) may be viewed through the Workflow Run Manager connected to the remote server (Fig 6).
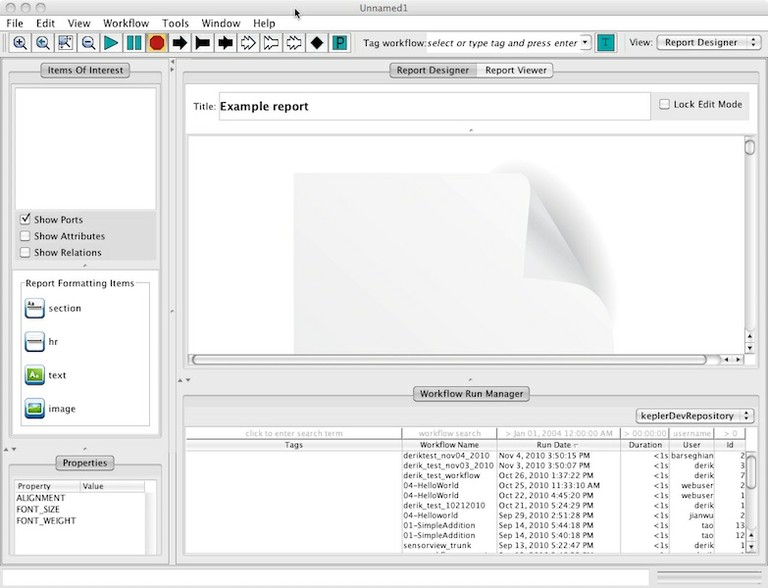
Figure 6
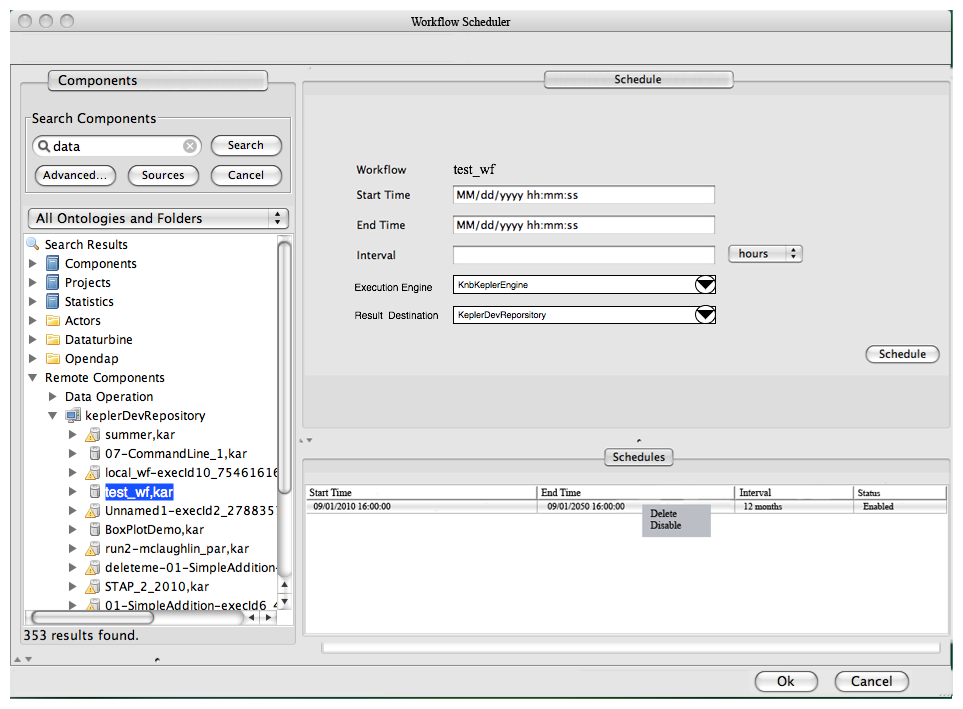
Figure 7
Analysis & Simulation
Use Cases
- Compare current sensor data with archived sensor data.
- Simulate sensor data.
Once a sensor network site has been configured (Figure 1), the site and sensor names can be accessed by searching in the Data tab (in the regular Kepler GUI). Dragging and dropping a particular sensor onto the (normal workflow view) canvas provides access to the sensor data. This data may then be compared to, e.g., archived data or the current output of other sensors.
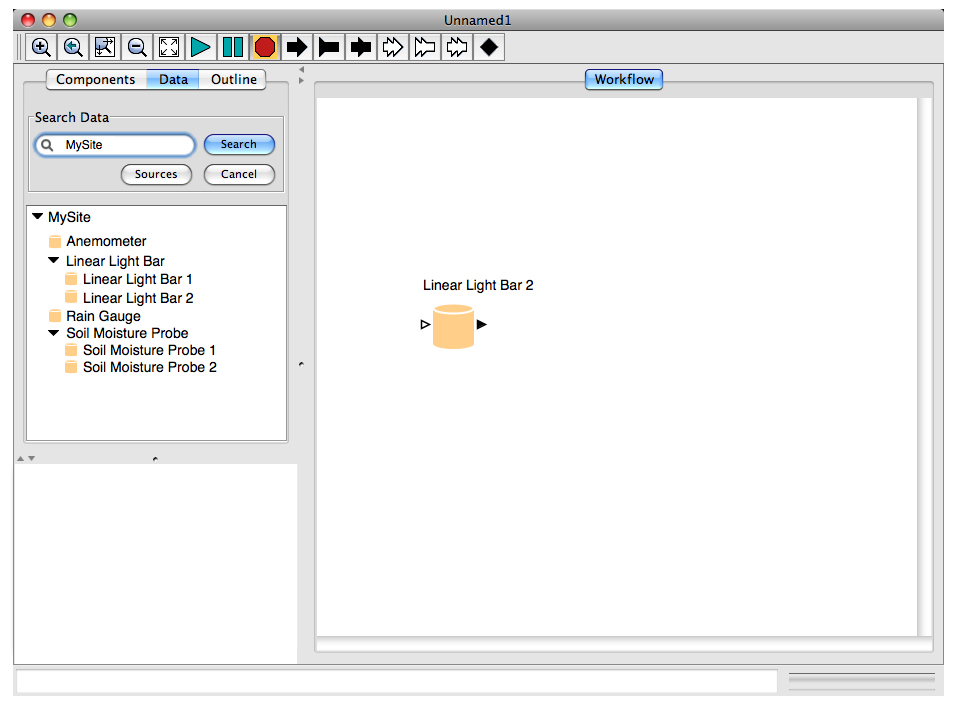
Figure 8
Sensor data may also be simulated. A scientist may wish to do this in case of hardware failure or to see the effects of changing sensor parameters. A workflow that simulates the data can be built and associated with the sensor as depicted in Figure 6; when the sensor is configured to simulate its output (Figure 2), the workflow is executed to produce simulated sensor data.
Control
Use Case
- Turn on or off a sensor, or change its sampling rate.
A scientist or engineer can control/configure the components in the Engineering View. These settings can be configured by editing the component's properties as shown in Figure 2.
Architecture
The architecture and APIs can be found here.
