Kepler Execution Monitoring
STATUS:
 The content on this page is outdated. The page is archived for reference only. For more information about current work, please contact the Kepler Execution Monitoring Group.
Goals
The primary goal of the Kepler Execution Monitoring (KEM) module is to facilitate the dynamic association of monitoring indicators for the components in a workflow in a way that is both as less intrusive as possible and as informative and easy to read as possible. Although end users (workflow executors as well as workflow designers) are the main target, the module also attempts to provide an API so actor developers can easily take advantage of the functionality perhaps with better control and more possibilities.
Motivation
Scientific workflows can take many forms. On one hand, the topology of concrete workflows may range from a simple linear sequence of steps, to more complex network configurations, while actor interaction may have different semantics depending on the particular model of computation associated with the workflow. On the other hand, the behavior of particular atomic actors may range from simple operations to complex and long-running tasks. As the configuration and execution characteristics of a given workflow gain in complexity, it becomes more problematic for the user to determine what the workflow and its individual components are doing at a given time from the graphical interface. Although several standard graphical actors and other logging facilities in Kepler and Ptolemy can help in this regard, there are some drawbacks and limitations. For example, inserting some of the graphical components (presumably just for monitoring purposes) may incur in both the cost of over cluttering the structure of the workflow and (in some cases) the inconvenience of launching separate windows. Also, logging information is often hard to read or otherwise demands adequate tools to make sense of the status of execution at both the workflow and component levels.
Status
This is an experimental project. At this early stage changes can certainly be made without notice. Comments and collaboration from anyone interested are welcome.Use cases
Here are some general KEM use cases. Feel free to comment and/or add other use cases.
#1: Automatic association of monitors with default styles
Summary: User performs a Kepler action to automatically associate activity icons to the first-level entities in the workflow during execution.
Basic course of events:
- User opens an existing workflow.
- User performs an action to include a "monitor manager" in the workflow.
- User starts the execution of the workflow.
- The monitor manager adds transient monitoring attributes to the entities in the workflow.
- The monitoring attributes provide visual feedback about the activity of the corresponding entities in terms of token reception and generation.
- Workflow completes its execution.
- Monitor manager removes the activity icons from the workflow canvas.
#2: Configuration of the monitor icons
Summary: User configures the various monitoring icons associated to the entities in the workflow. This configuration consists in specifying the basic style of each icon and the set of events that should trigger the update of the icon. The monitor manager takes care of this configuration including its storing for future executions.
Basic course of events:
- User opens the parameter window associated with the monitor manager in the workflow.
- For each entity in the workflow, the monitor manager allows the user to indicate the style and the events to be monitored.
- Configuration is kept as a set of attributes associated with the monitor manager so that they are persistent if the user saves the workflow.
#3: Token reception/generation monitoring with a traffic light
Summary: This is a monitor configuration case in which a traffic light is associated with an actor. The traffic light will change its active color depending on the recent reception/generation token activity in the actor. It will be "green" as soon as a token has just been received or produced; it will be "yellow" when a user-specified amount of time has passed without any token activity; it will be "red" when some error prevents the actor from continuing its execution.
#4: Token count monitoring
Summary: This is a particular monitor configuration case for an actor in which a counter label is associated with each port/channel in the actor. The label will show the total number of tokens being received/generated through the channel. The label can be colored according to the recent activity in the channel in a similar way as with the traffic light.
User guide
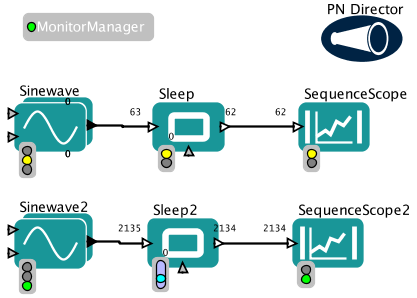
There is no explicit command in Kepler to enable the monitors in a workflow. To enable the monitoring functionality, an instance of the org.kepler.monitor.MonitorManager attribute has to be inserted in the workflow. This can be done by using the "Instantiate attribute" option in the "Tools" menu.
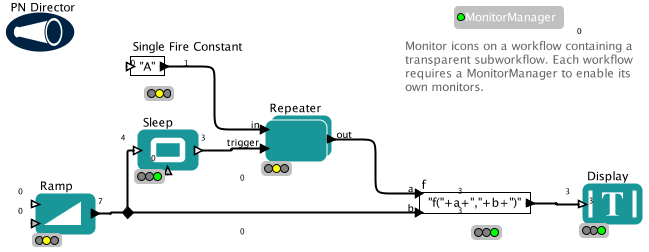
By default, the MonitorManager attribute will create and associate monitor attributes for both actors and composite entities in the workflow. This is done at execution time. In general, these attributes will be destroyed when the execution is completed. A monitor icon is placed close to the monitored element, and its location is automatically updated whenever either the monitor or the monitored element is relocated.
Currently, the possible icon styles for the monitors are:
- traffic light (various styles)
- progress bar (indeterminate and determinate styles)
- simple label (eg., for counters)
Although the style for each monitor attribute can be changed during execution by adjusting the parameters in the corresponding parameter window, the changes will apply only for the current execution.
Demo workflows:
| workflows/test/monitor/monitor-0.xml |
 |
| workflows/test/monitor/monitor-subw-0.xml |
 |
Current limitations
- Configurability is very limited
- Composite entities are not properly handled yet
- Counters for composite actor ports are not properly placed
- Concurrent modification exceptions are thrown sometimes
Developer notes
Implementation challenges
The challenge here is more regarding the "visual" aspect than the "technical" one: How to lay out the monitors (especially at the port/channel level) such that the workflow doesn't get cluttered? Of course, we can let users locate their monitor attributes themselves, but it's an interesting problem how to do it in an automated and elegant way (eg, graphviz, in the case of graphs, for example). Yes, this is in general a non-trivial problem but interesting anyway.Design
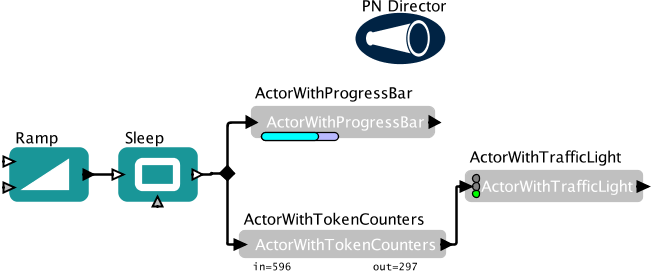
Package org.kepler.monitor.test contains some demo actors that explicitly use some of the monitor icons. To run a test:
   cd $KEPLER
   ant -Dworkflow=workflows/test/monitor/monitor-1.xml run-wf
| workflows/test/monitor/monitor-1.xml |
 |
Design notes
Still very terse. Please, see source code for more details.
Main package: org.kepler.monitor
	MonitorManager
	MonitorAttribute
	MonitorIcon
	MonitoredStatus
	FigureUpdater
Figure package: org.kepler.monitor.figure
	BaseFigure
	ProgressBarFigure
	TrafficLightFigure
Test package: org.kepler.monitor.test
	ActorWithProgressBar
	ActorWithTrafficLight
	ActorWithTokenCounters
The MonitorManager automatically associates MonitoredStatus objects to the entities in a workflow. The status object abstracts the events (property changes) that need to be reflected in the monitors. Then, the manager creates the corresponding monitor attributes (MonitorAttribute) including counters for input and output ports. Both actors and (to some extent) composite entities are handled. A MonitorAttribute contains a MonitorIcon. All changes are made non-persistent. The actual style of the icons is determined by the figure in the icon. Various styles are included in the org.kepler.monitor.figure package. The updates are triggered by a FigureUpdater object in reaction to property changes ocurring in a MonitoredStatus object. See the example code in the org.kepler.monitor.test package.
The MonitorManager also registers an Initializable object so the icons are created at runtime and destroyed when the execution finishes. It also registers a GraphViewListener so the location of the icons are updated when their monitored objects are moved on the canvas.

